1 参数设置
import numpy as np

import matplotlib.pyplot as plt

import pywt

wavelet = 'cgau8'

sampl_freq = 100 # 采样频率越小越好

width = np.arange(1,100) # 宽度范围越大越好

freq = sampl_freq*pywt.central_frequency(wavelet)/width # 0.7 - 140 Hz

Maxfreq = 10

Minfreq = 0.1

print(freq[0], freq[-1])
2 初始输入信号
L = 6

t = np.linspace(0, L, L*sampl_freq, endpoint=False)

mean1,mean2,mean3 = L/1.2,L/2,L/4

sigma1,sigma2,sigma3 = L/8,L/8,L/8

gauss1 = np.exp(-1*((t-mean1)**2)/(2*(sigma1**2)))/(np.sqrt(2*np.pi) * sigma1)

gauss2 = np.exp(-1*((t-mean2)**2)/(2*(sigma2**2)))/(np.sqrt(2*np.pi) * sigma2)

gauss3 = np.exp(-1*((t-mean3)**2)/(2*(sigma3**2)))/(np.sqrt(2*np.pi) * sigma3)

f1 = np.cos(2*np.pi*3*t) * 1

f2 = np.cos(2*np.pi*4*t) * 1

f3 = np.cos(2*np.pi*2*t) * 1

y1 = f1*gauss1 + f2*gauss2 + f3*gauss3
3 小波变换
cwtmatr1, freqs1 = pywt.cwt(y1, width, wavelet, 1/sampl_freq) # scales = 2*np.pi*width/400
4 绘图
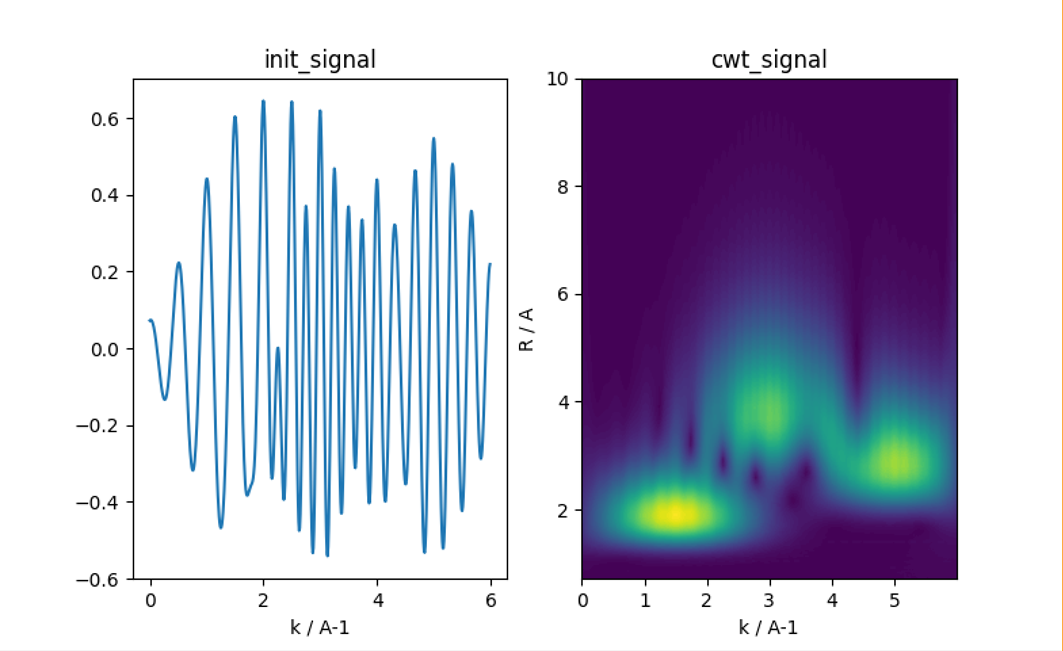
plt.subplot(121)

plt.plot(t,y1)

plt.title('init_signal')

plt.xlabel('k / A-1')

init_point = np.where((freqs1<=Maxfreq) & (freqs1>=Minfreq))[0][0]

final_point = np.where((freqs1<=Maxfreq) & (freqs1>=Minfreq))[0][-1]

plt.subplot(122)

plt.contourf(t,freqs1[init_point:final_point], abs(cwtmatr1[init_point:final_point,:]),100)

plt.xlabel('k / A-1')

plt.ylabel('R / A')

plt.title('cwt_signal')

plt.show()
